
EFD Lab DEID Data Visualization
Please note these data are experimental. These data are only here to allow people immediately involved in the project quick access. The user assumes the entire risk associated with its use of these data. The University of Utah shall not be held liable for any use or misuse of the data described and/or contained herein. The User bears all responsibility in determining whether these data are fit for the User's intended use.
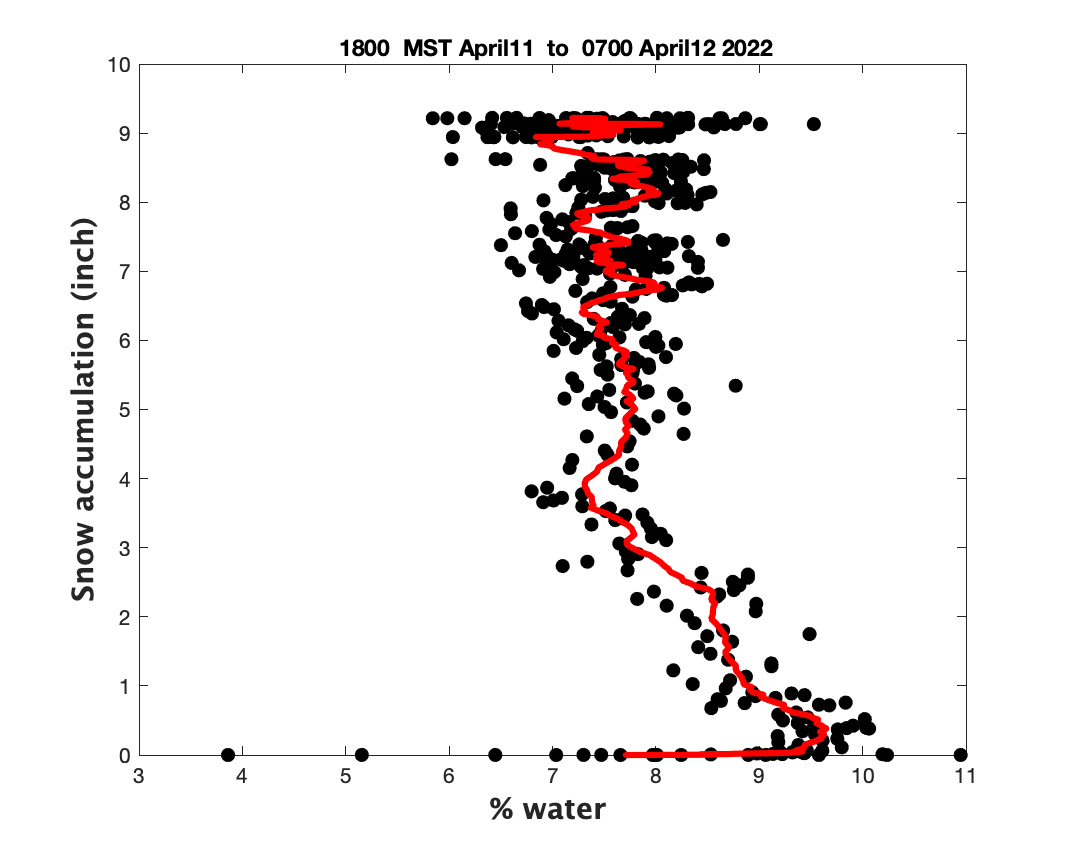
Figure 1 (above) Profile of snow accumulation and snow density (% water)
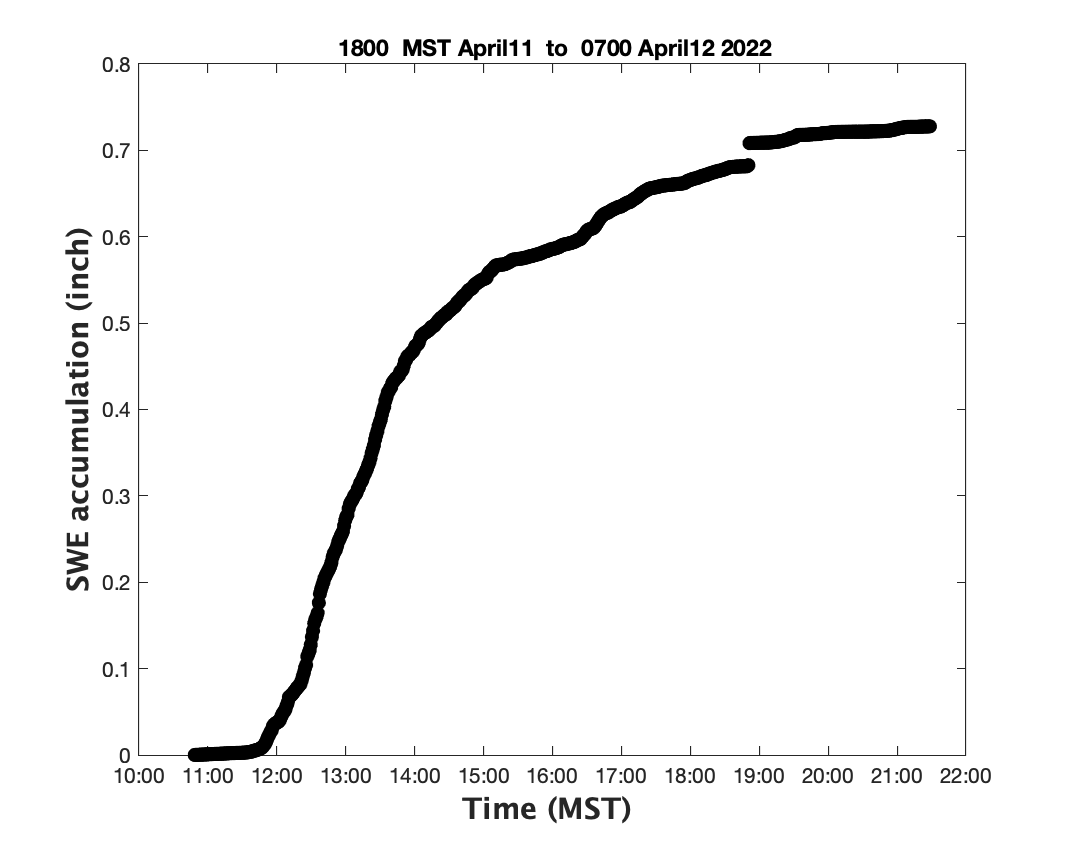
Figure 2 (above) SWE accumulation as a function of time.
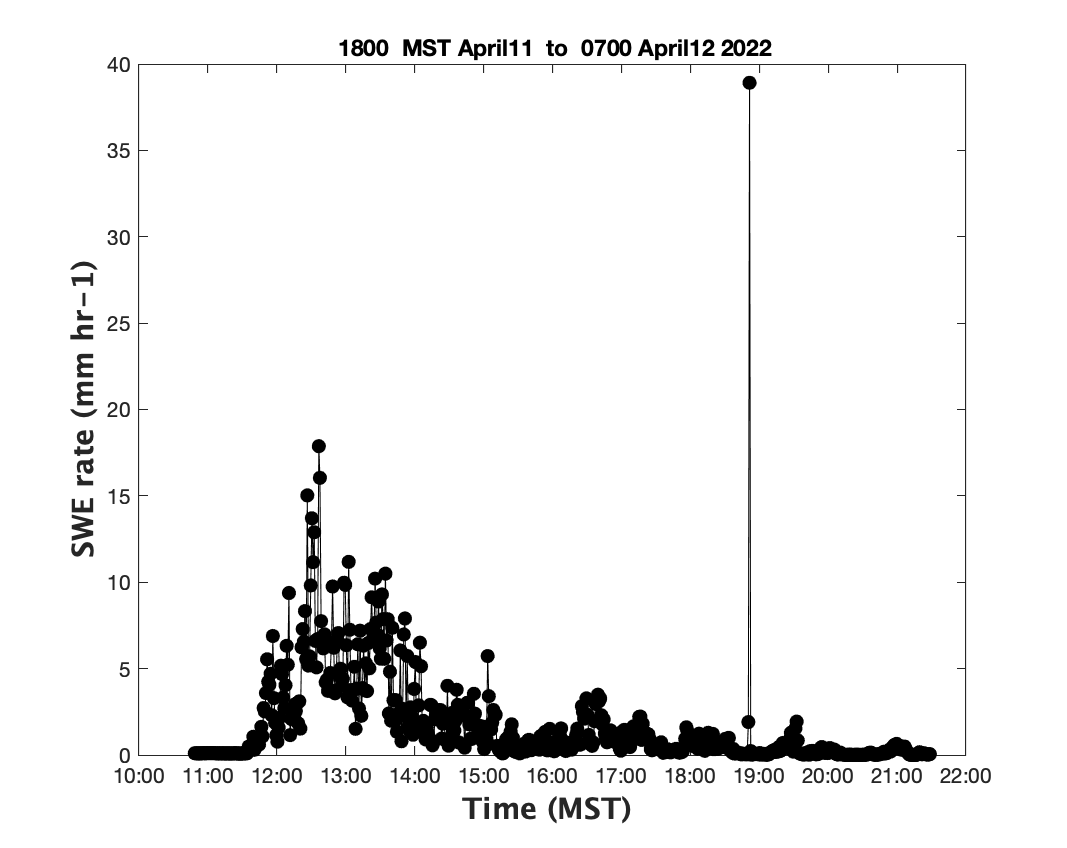
Figure 3 (above) SWE rate as a function of time.
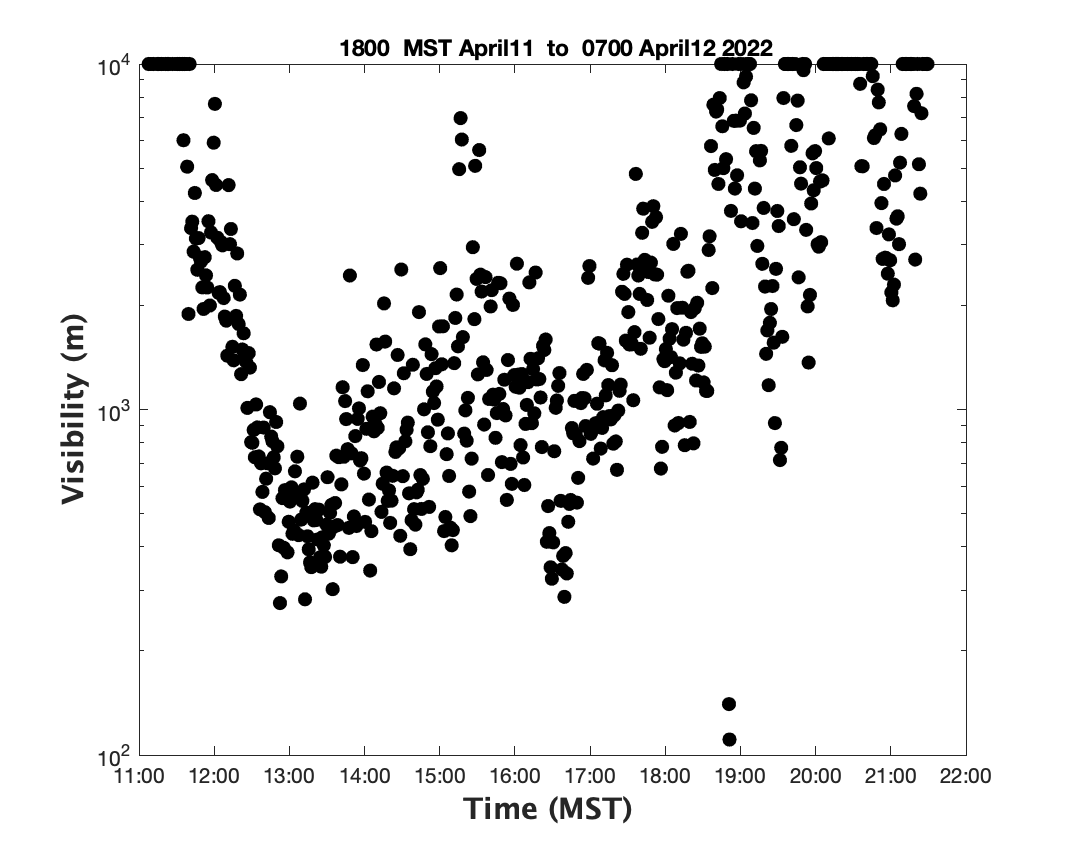
Figure 4 (above) Visibility (km) as a function of time. (maximum visibility is set 10 km)
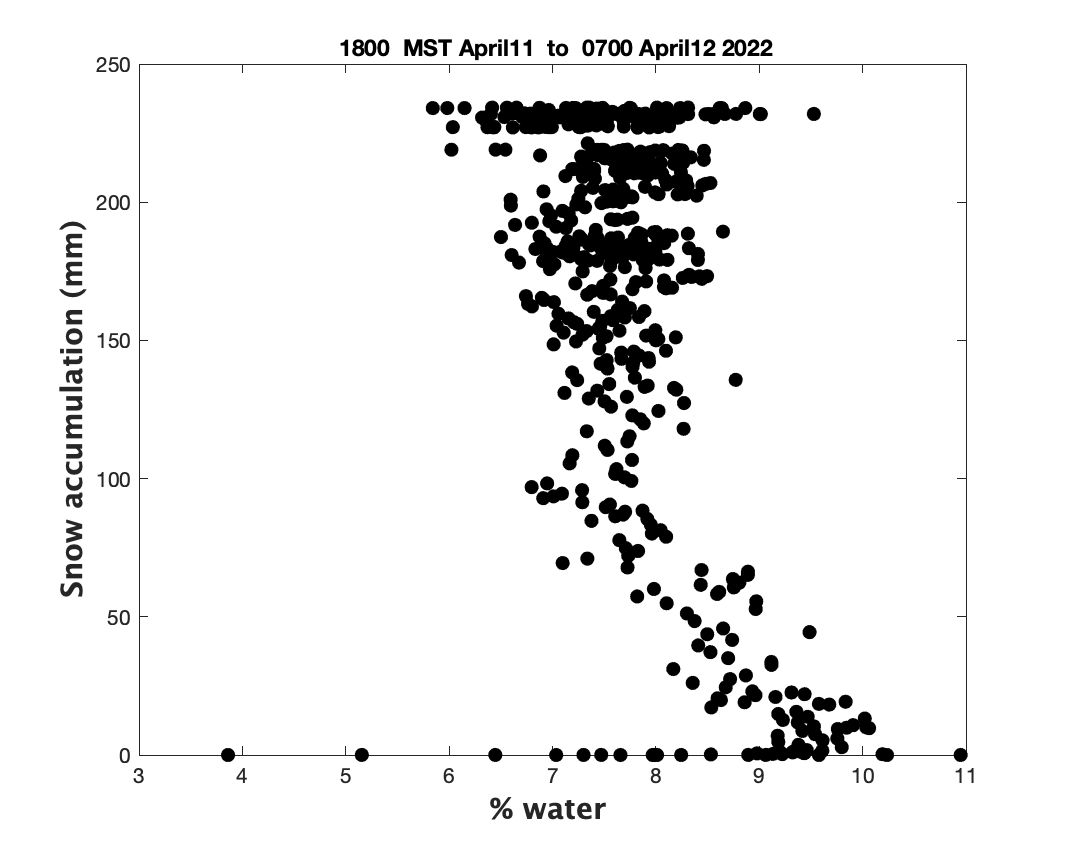
Figure 5 (above) Profile of snow accumulation (in mm) and % water and snowflake complexity is on the right y-axis.
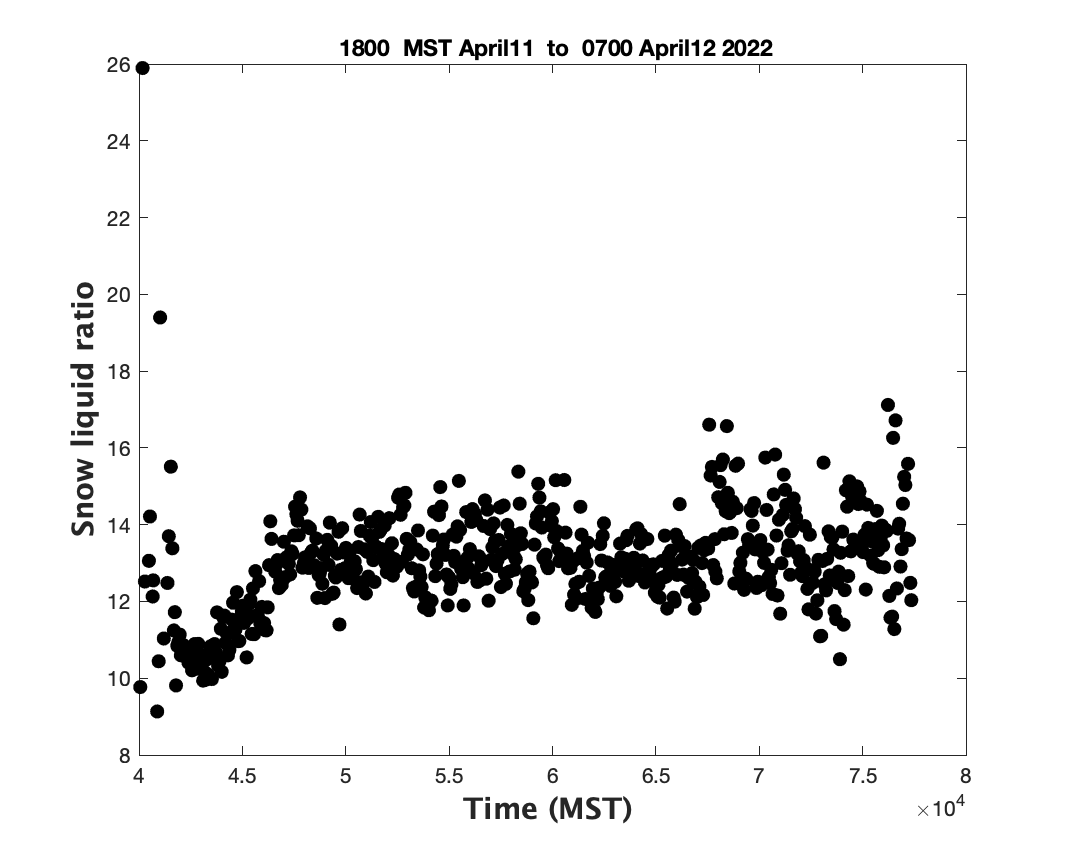
Figure 6 (above) Time series of snow-liquid-ratio (SLR).
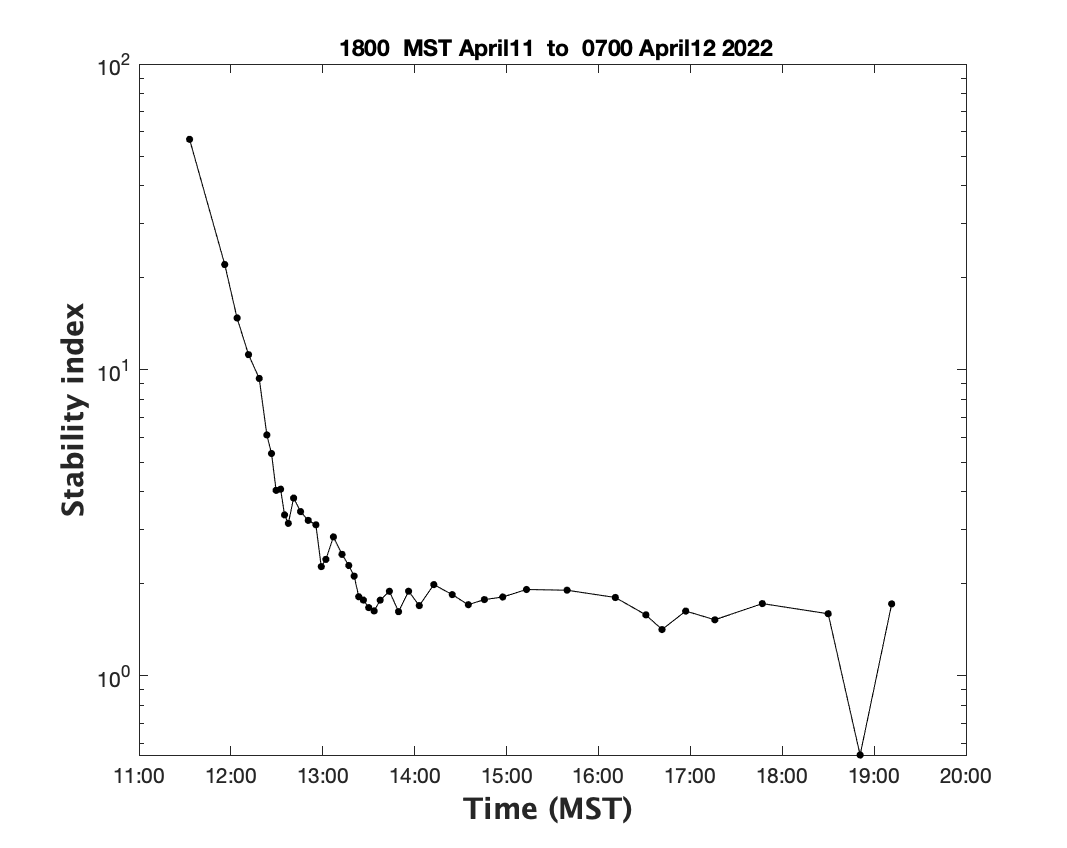
Figure 7 (above) Stability index. As the stability index approaches one the likelihood of a natural avalanche increasess.
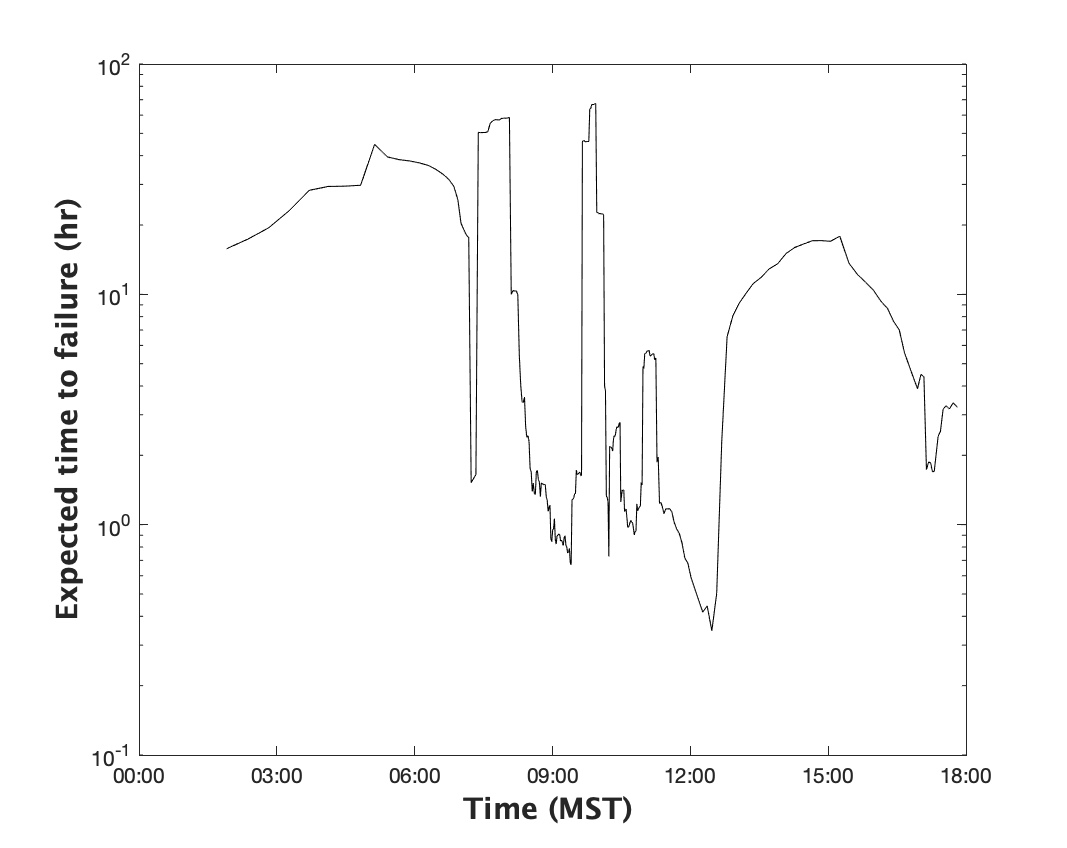
Figure 8 (above) Expected time to failure.
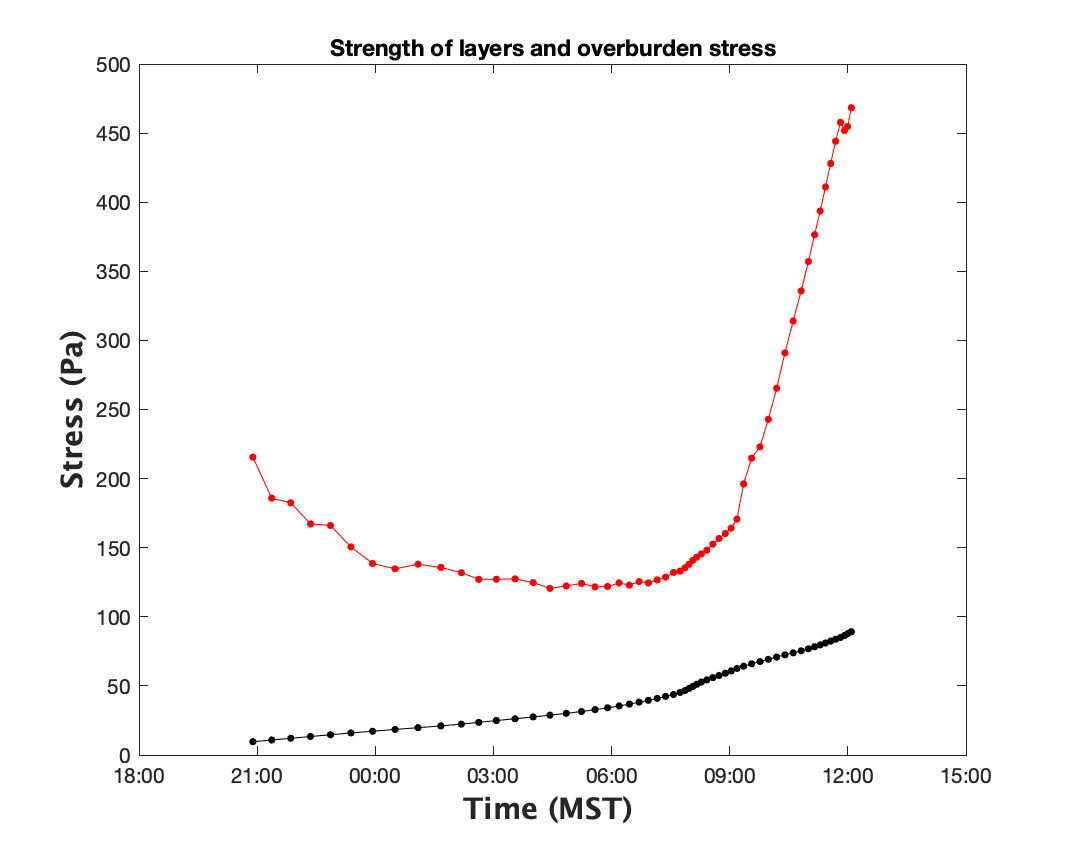
Figure 9 (above) Basal layer stength and overburden stress.
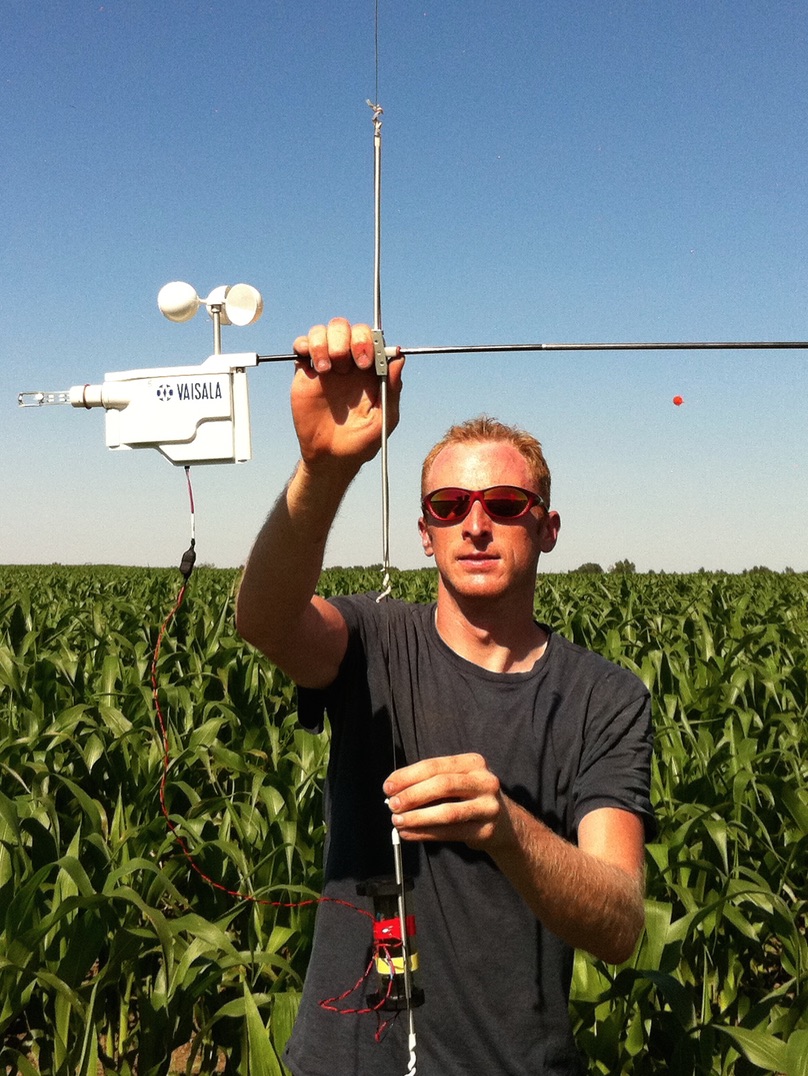
The DEID is a new hydrometeor (snow and rain) measurement device. The acronym stands for Differential Emissivity Imaging Disdrometer, which is being developed at the Universtiy of Utah. DEID data discussion will go here. This site is currently under construction.
Development of the DEID has been supported by a sub-contract to the University of Utah through a grant to Particle Flux Analytics Inc from the U.S. Department of Energy (DOE) Atmospheric System Research program award number DE-SC0016282. A patent is pending. The DEID work has also been made possible by the Transportation Avalanche Research Pool (TARP), AltaDave Richards and the Alta Avalanche Office, and the U.S. National Science Foundation (grant number PDM-1841870).