Resources
Home
Step 7 - Analyzing the Results
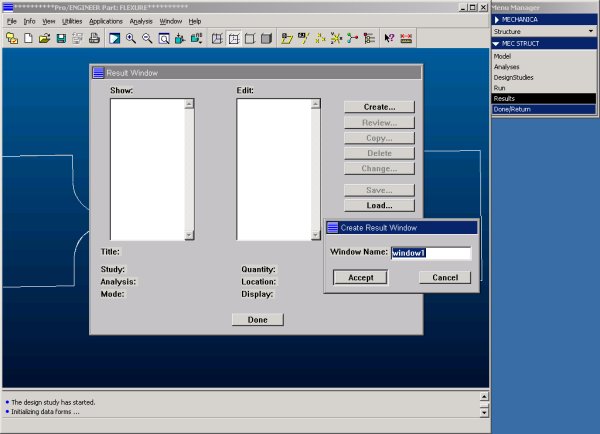
To display the result of the analysis we first have to create a result window.
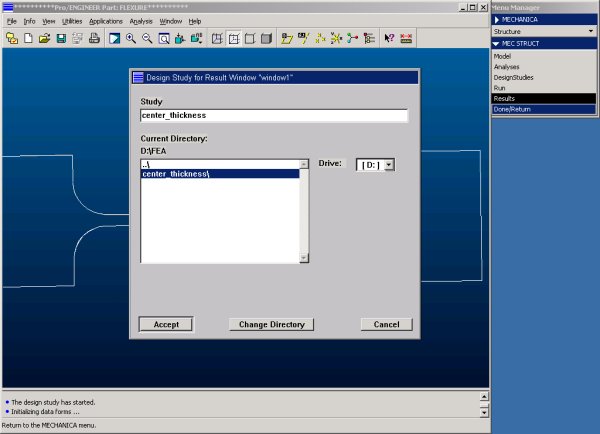
Next we select the analysis we would like to examine.
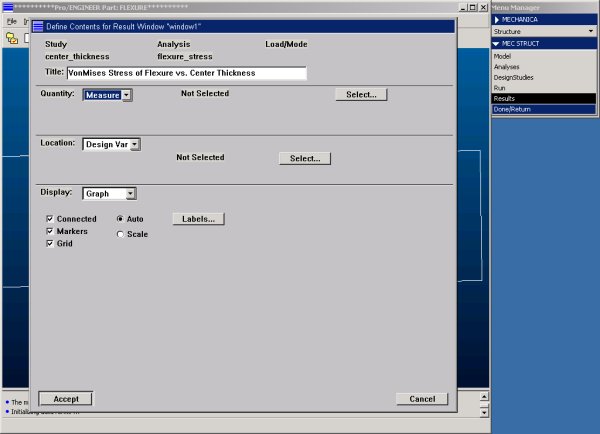
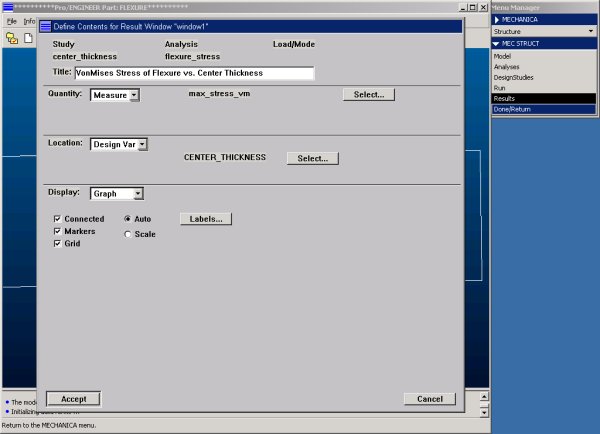
We use the top text line to give it a title,
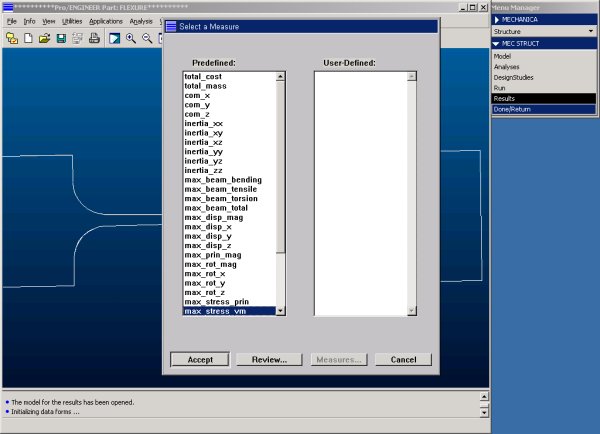
and select VonMises (max_stress_vm) stress as the measure to be shown.
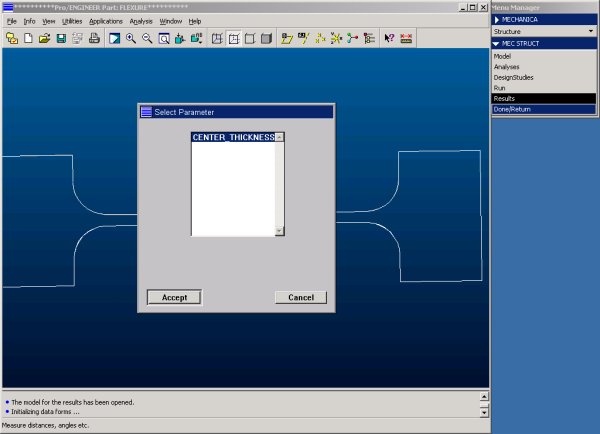
Now we select the parameter against we wish to plot the result
At this point everything necessary to display the result is defined.
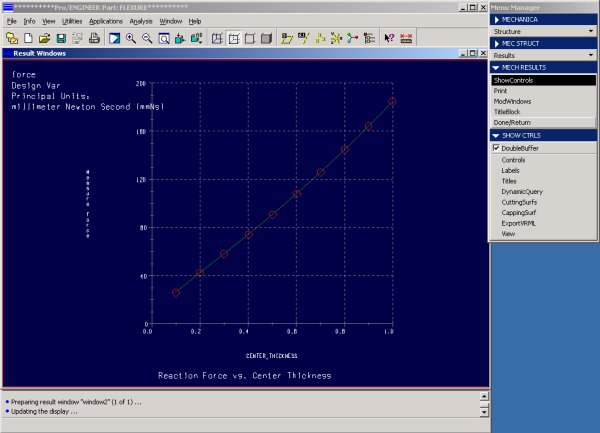
And this is what the result looks like.
In the above example, the center thickness of the tapered beam was varied from 0.1 to 1.0 in 10 steps. The maximum VonMises stress depending on the center thickness can be seen in the above graph. The stress initially decreases to a minimum value of around 2100 N/mm^2 at 0.2 mm. After that, the stress steadily increases with the thickness of the beam. The result indicates that the maximum stress within the tapered beam highly depends on the center thickness of the tapered beam, a result one would expect for a beam as shown. We can also see that the examined flexure design is not a viable solution because the stresses are much too high for stainless steel which yields at around 800 N/mm^2 already. At the given displacement, the tapered beam section will either have to be longer or thinner at the ends (or preferably both).
The force required to displace the flexure by 3 mm can be seen in the following graph: